Official Forecast for the Winter of 2019-20
Introduction
Yes, I know you've probably read this hundreds of times and felt the changes firsthand, but it's that time of year again. November; the month where the warm, moist air of the tropics battles the cold, dry air of the arctic (though the cold air seems to be in firm control this November). During this month, winter forecasts get released left and right, and sometimes, we are already talking about wintry weather.
So what do we have in store for this winter? I'm going to be going over the various factors we look at, mostly in the Pacific Ocean. The Pacific is so important because weather moves from west to east in the northern hemisphere due to the jet stream. This means all of our weather features interact with various features in the Pacific Ocean before making it to the US. I'll also be discussing features that aren't in the Pacific, but still play a large role in our weather.
I'm going to start with the forecast summary, including temperature and precipitation maps, and then I'll discuss my forecast logic. So let's get into it!
I'm going to start with the forecast summary, including temperature and precipitation maps, and then I'll discuss my forecast logic. So let's get into it!
Forecast Summary
Let me start off by saying my winter forecast includes March. It has behaved like a winter month many times over, so I'm going to treat it like one. So without further ado, here is my official winter forecast (Dec-Mar) of 2019-20!
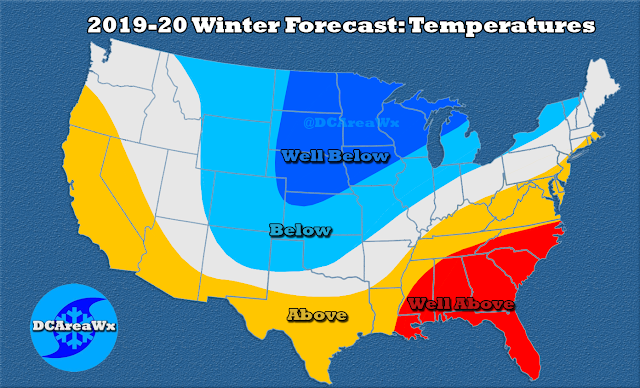
Let's start with the temperatures. I expect the Northern Plains and parts of the Midwest to see the most below average temperatures, and the southeast US to once again see the most above average temperatures. For the DC area in particular, we could potentially see a milder December, an average January and February, and a colder March. Remember to check out my forecast reasoning below to understand why my forecast is like this.

Let's start with the temperatures. I expect the Northern Plains and parts of the Midwest to see the most below average temperatures, and the southeast US to once again see the most above average temperatures. For the DC area in particular, we could potentially see a milder December, an average January and February, and a colder March. Remember to check out my forecast reasoning below to understand why my forecast is like this.

Now, let's get to precipitation. I think portions of the Midwest, Tennessee Valley, and Southeast should see the most above average precipitation. I expect parts of the southwest to see the most below average precipitation. Precipitation is much harder to forecast than temperatures in my opinion, because it varies much more year to year. A couple big storms over an area could easily ruin a forecast, so I won't be doing a month by month forecast for DC.
Now, let's get into my forecast reasoning, so you can see how I put this forecast together.
Equatorial Pacific
.png) |
| https://www.weather.gov/mhx/ensowhat |
I'll be starting off with the ENSO, which tends to have the largest impact on US winters. This is a strip of ocean (shown below) in the equatorial Pacific that can have major impacts on US weather. What we look at is whether the SST's (sea surface temperatures) are above or below normal in this region (El Niño and La Niña respectively).

This year, the ENSO is in an abnormal configuration. Overall, it's neutral (average temps), but this doesn't give you the full picture. The eastern pacific is below normal, and the central/western pacific is above normal. This puts us in a weak central based El Niño, which has different impacts than a classic El Niño.
 |
| Bureau of Meteorology |
The IOD is another equatorial teleconnection. I won't go into too much detail about it, but the bottom line is that it is very positive right now. Research shows that a +IOD tends to support an El Niño rather than a La Niña. Because of this, I expect the ENSO to gradually warm throughout the winter months, though never become overly strong. Because of the weak state of the ENSO, other teleconnections can overpower its influence, which unfortunately makes this forecast even harder than usual. So let's go to our next region.
North Pacific
 |
| Example of a +PDO: https://climate.ncsu.edu/climate/patterns/pdo |
The North Pacific is a mess. Usually, we talk about the PDO, which is an area of ocean off western North America. A +PDO tends to increase ridging over western North America, and a -PDO increases troughing. This year's "PDO" doesn't look much like a normal PDO, so it will have different impacts.

This SST configuration looks like a +PDO that was shifted west. Therefore, my expectation is that we will see +PDO impacts that are shifted west. This would favor troughing in the Central US and Midwest. The warm blob should also should help amplify our pattern due to its intensity, which leads to more anomalous weather (both warm and cold).

Since the North Pacific is yet another very abnormal factor this year, this winter forecast is even more difficult to forecast. If you are having difficulty envisioning all of this so far, I have made a graphic (shown above) that summarizes my thoughts on the role the entire Pacific will play on our winter.
QBO
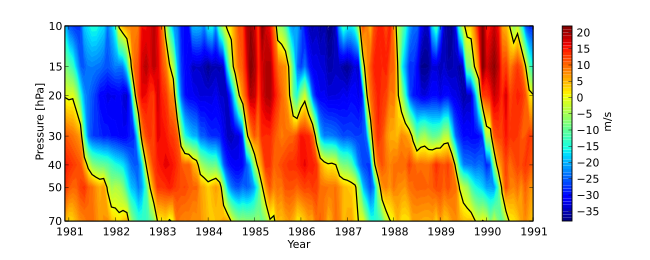 |
| Orange is westerly and blue is easterly: https://en.wikipedia.org/wiki/Quasi-biennial_oscillation |
The QBO is a band of winds high above the equator that either blow west or east. They start in the stratosphere and work there way downwards until dissipating in the troposphere. After they dissipate, the process starts again, except with winds blowing from the opposite direction. So why is this oscillation important?
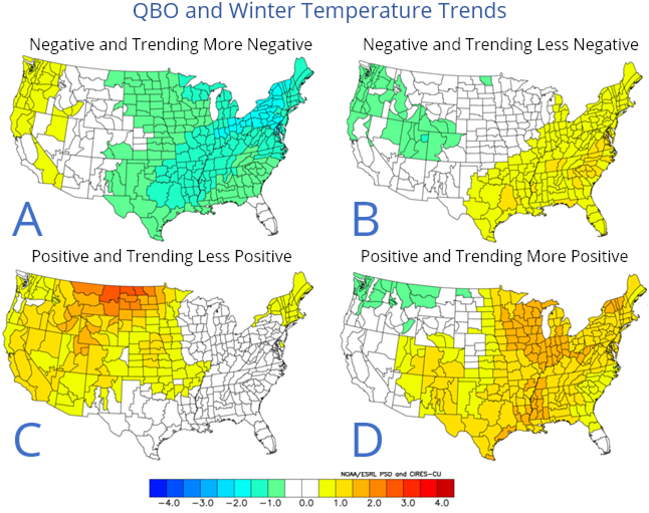 |
| https://blog.weatherops.com/will-the-negative-qbo-increase-the-odds-for-a-colder-winter-this-year |
Well, an easterly QBO tends to weaken the jet stream, and a westerly QBO does the opposite. This act affects the AO and NAO (which I will talk about momentarily), which is why it's so important. A weaker jet stream allows colder air to push south frequently, and a stronger jet stream doesn't. This year, we should start off in a westerly QBO but transition to an easterly QBO, which may make the second half of winter interesting.
AO and NAO
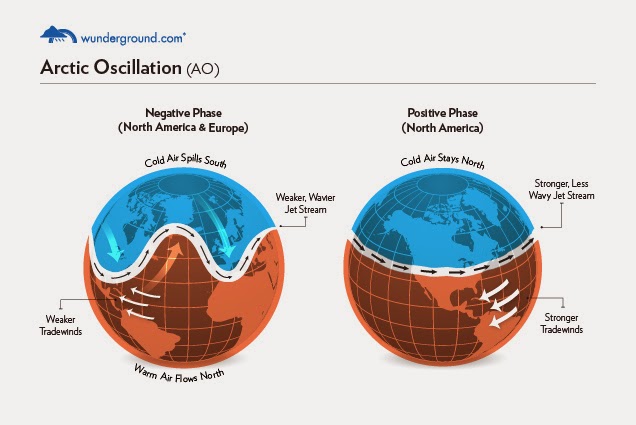


While it's very difficult to forecast these oscillations as they flip on a weekly basis, what you can forecast is which phase will persist throughout the majority of winter. To do this, we have to look at all sorts of things, including the teleconnections that I've mentioned, the solar cycle, and early season arctic snow coverage.
I won't go into great detail about all of these factors, but the bottom line is that we are in a solar minimum and early season snow coverage is above average. This combination, the north pacific setup, and the transitioning QBO all favor a -AO and -NAO dominated winter. However, the status quo of recent years has been the opposite (+AO and +NAO). Due to this, I believe we will see the negative phases of these oscillations only slightly more than the positive.
I won't go into great detail about all of these factors, but the bottom line is that we are in a solar minimum and early season snow coverage is above average. This combination, the north pacific setup, and the transitioning QBO all favor a -AO and -NAO dominated winter. However, the status quo of recent years has been the opposite (+AO and +NAO). Due to this, I believe we will see the negative phases of these oscillations only slightly more than the positive.
Analogs
 |
| If you want to see the analog years month by month, plug them into the site attached, reading all of the given instructions: https://www.esrl.noaa.gov/psd/data/usclimdivs/ |
Analogs are my absolute favorite forecasting tool. Analogs are previous years which had a similar SST configuration to this year. There's a decent likelihood that the SST configuration we are currently seeing is pretty similar to at least a few years in the past. If we can find these years, we can determine what seems to be a common theme during those winters, and integrate it into the forecast for this year.
I'll be honest and say I really like my analog set for this year. The SST configuration for my analog years are very similar to this year. Furthermore, September, October, and November temps of this year all match the analog set. I had other analog sets which matched the SST's, but none of them matched the actual weather that occurred in the US, so this was an exciting find.
On this analog set, December is very mild everywhere in the US except the southwest. January is the coldest in the northern plains, and milder in the southeast and the west coast. February is pretty similar to January except not as mild in the west. March is very cold in much of the eastern and central US, and milder out west.
 |
| Temp and precip anomalies from recent history compared to the 30 year average |
Another thing that makes me confident in this analog set is that it matches what we've seen frequently this decade; a mild start to winter and a cold finish. Analogs were the most influential portion of my forecast, and served as a base for my forecast. The biggest change I made was accounting for how climatology has changed in recent years. I also used my knowledge on the behavior of the other teleconnections to determine where additional changes were needed.
Thanks for reading to the end!
That's all I have for you guys, thanks so much for reading. I'll make sure to post updates on my Twitter account as necessary (@DCAreaWx), but I'll be mostly focusing on imminent threats. If you have any questions or need clarification on anything, feel free to comment. Thanks again!